
“Interest rates go up and down, stock markets boom and bust, but human psychology never changes. I believe that studying how people think about and react to markets—and particularly studying the most common mistakes investors make—can give us an edge in a surprising world.” – Dan Rasmussen, The Humble Investor
Tariffs aren’t the only scary thing investors have had to deal with recently. The last few years have read like a science fiction novel rather than reality.
April 14, 2020: “‘This crisis is like no other’: Coronavirus recession will likely be worst since the Great Depression, predicts IMF” – Fortune.com
February 24, 2022: “Peace in Europe Shattered as Russia invades Ukraine” – CNN
December 30, 2022: “Stocks fall to end Wall Street’s worst year since 2008, S&P 500 finishes 2022 down nearly 20%” – CNBC
March 15, 2023: “Silicon Valley Bank Collapses, Investors Panic as Banks Start to Fall” – BiggerPockets.com
Which brings us to today, one would have no problem finding hundreds of similar headlines…
April 9, 2025: “Trump Tariff bomb triggers historic $10 trillion market crash” – The Economic Times
The wild daily swings in the stock market, uncertain policy, and lack of a historical parallel have left investors confused, perplexed, and on edge.
We can’t predict what the next crisis will be (no one can), but you can set your watch to how most investors will react.
During periods of market decline, investors panic sell, try to time the market, and abandon their long-term investment strategy. To an emotional investor, it seems like the bad times will never end.
Good markets bring equally destructive behavior.
Investors crowd into the best performing stocks & assets classes, throw risk management out the window, think the good times will continue forever, and embark in risk seeking behavior (abandoning diversification, speculating, getting caught up in investment fads).
Obviously, this is a horrible way to invest.
Here’s an open secret; there’s no certainty in investing. The only certainty is uncertainty.
The closest thing to a “fat pitch” in investing is putting capital to work in a crisis market environment.
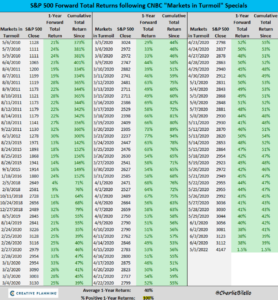
This isn’t anecdotal. CNBC runs a “Markets in Turmoil” series during especially painful episodes…
Source: Creative Planning, Charlie Bilello
The above graph shows S&P500 1-year forward returns after CNBC’s “Markets in Turmoil” specials. Since the series started in 2010, the average 1-year return for the S&P 500 is 40%, with a 100% positive hit rate. An investor glued to the TV with ‘markets in turmoil’ flashing before their eyes might have made a disastrous decision to sell.
We should note CNBC hasn’t run this series back (perhaps due to the dismal track record after the episodes ran).
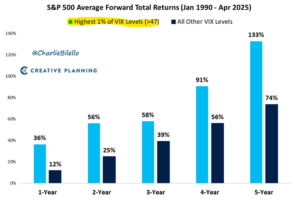
When volatility spikes, that’s also a contrarian signal for future S&P 500 returns…
Source: Creative Planning, Charlie Bilelo
The above graph shows average forward total returns when volatility spikes (measured by highest 1% of volatility readings). Since 1990, when the VIX spikes above 47, future S&P 500 returns (light blue) are quite strong. For context, the VIX reading hit ~60 on 4/7/2025.
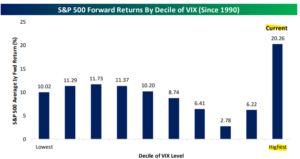
Here’s another S&P 500 1-year forward return matrix based on volatility (VIX) levels…
Source: Bespoke Investment Group
The above chart shows S&P 500 1-year forward returns based on volatility levels (the highest readings are on the right). The current high VIX readings historically indicate above average 1-year S&P 500 returns (far right bar).
In real time, every crisis feels like it’s the worst thing ever with no end in sight. In hindsight, the crisis subsides, and we look back at the selloff as an obvious buying opportunity. For investors that wait for the illusionary “all-clear” signal, it’s often too late.
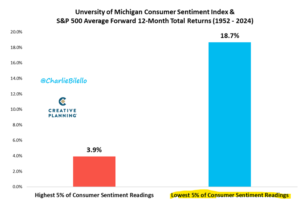
We can also look at ‘soft’ survey data and see a similar story. Much has been made about the cratering consumer sentiment readings. Most people think the economy is going into the dumps. Turns out this is a very good (and accurate) contrarian indicator…
Source: Creative Planning, Charlie Bilello
The above graph shows forward S&P 500 1-year returns from consumer sentiment levels (1952-2024). When consumer sentiment is in the lowest 5% of historical readings, S&P 500 1-year returns are ~19% (blue).
This isn’t to say we’ve seen the worst and we are in the clear. As we said in last week’s blog, markets can flip on one tweet.
It’s grossly understated how bad humans are at forecasting. We can gain an advantage over investors that lean too heavily into hubris and prediction by studying history.
In our opinion, the closest thing to a “fat pitch” in investing is putting capital to work in a crisis market environment.
As we’ve highlighted, putting cash to work when it feels like you want to puke can be a pretty good investment strategy.