
“In investing and life, you will make better decisions if you assume you are wrong and try your best to prove it by finding the most authoritative opposing views.” – Peter Mallouk, Creative Planning
I’ll let you in on a secret. I’ve never seen anything like this in my 20+ years managing portfolios.
As of this writing (3/18/25), the S&P 500 is down 3.51% year-to-date.
If you looked at a 30-year chart of the S&P 500, the selloff wouldn’t register if you had a magnifying glass.
Is this sell-off different? Not compared to recent history.
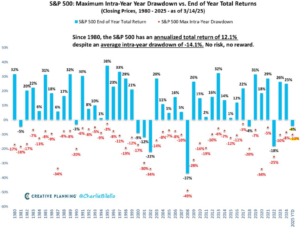
Every year since 1980, the S&P 500 has had an average drawdown of -14%…
Source: Creative Planning, Charlie Bilello
The above chart shows the maximum intra-year drawdown (red) for the S&P 500 (1980 – 2025) vs. end of year total returns (blue). Since 1980, the average maximum intra-year drawdown for the S&P 500 is ~14%. The current drawdown max is 10%, well below the average for the past 45 years.
This is where it gets confusing and interesting. I still can’t believe it.
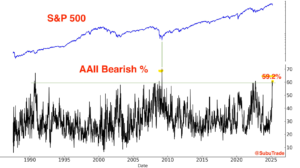
Investor sentiment is currently at similar levels to March 2009. During that period, the S&P 500 experienced a ~54% drawdown over 17 months.
Source: SubuTrade, Subutrade on X
The above chart shows the American Association of Individual Investors (AAII) weekly survey reading (week of 3/12/25). The “bearish” reading, the percentage of investors that think things will get worse over the next six months, has been above 55% three weeks in a row. This occurred one other time in history, March 2009.
Source: Zero Hedge
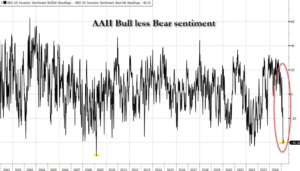
The above chart shows the same AAII survey (3/12/25) showing bull sentiment (bull = things will get better) minus bear sentiment (things will get worse). Current sentiment levels are consistent with a crisis market environment posting a similar reading to 2008-2009.
Let’s recap…
- As of 3/18/25, the S&P 500 is down ~3.5%
- The average maximum intra-year drawdown for the S&P 500 is -14.1%. The current drawdown is -10%.
- Investor sentiment is consistent with the 2008-2009 Financial Crisis, which saw a drawdown of 54% over 17 months.
Why is this correction hitting investors so hard?
It’s complicated, but we have a few theories.
Pain is Concentrated in the Most Crowded Trades
We see many prospective client portfolios. Some are do-it-yourself investors; others are working with another financial advisor. Without exception, almost all of them are heavily over-allocated to the Magnificent 7 stocks.
Unfortunately, that’s where the biggest ‘pain trade’ has occurred…
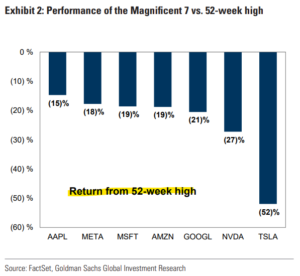
The above chart shows the drawdown from the 52-week high for the Magnificent 7 stocks. Investors tend to crowd into stocks with recent outperformance, which can work until it doesn’t.
Investors are Mixing Politics & Investing
Folks know better, but many can’t help themselves. Politically charged responses are showing up in virtually every weekly/monthly survey…
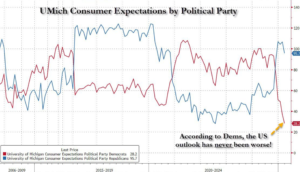
Source: University of Michigan Consumer Expectations
The above chart shows consumer expectations by political party. Survey participants that identified as Democrats (red, I think they got the colors switched) are feeling economic prospects are dire. Republicans (blue) on the other hand, are feeling pretty good. The intersection of politics, investing, and economic prospects has always been a dicey proposition. Mixing them together and you have the potential for emotional decisions.
Unrealistic Expectations
In our November 7th, 2024 post, “Could Future S&P 500 Returns Be Lower?”, we highlighted the dangerous set up for investors…
“We wouldn’t bet against the ingenuity of U.S. corporations, but the set up for the decade could leave investors disappointed.
A Vanguard survey showed investor return expectations for U.S. large cap stocks at 7.9% per year. This is an all-time high reading in the survey.
Performance chasing and all-time high expectations isn’t a good recipe.
If history is a guide, investors could do well to downshift their return expectations for U.S. mega caps. That might mean reducing U.S. large cap concentrations, adding to other equity asset classes (small cap, value, real estate, foreign stocks), or rebalancing.”
Miserable News Headlines Attract Eyeballs
News outlets have figured out people love a good trainwreck. Hence, they lead with headlines that elicit fear, anger, and disgust.
Pessimism sells.
Michael Antonelli, Market Strategist at R.W. Baird, wrote…
“We are running a great behavioral experiment where we pump negativity into humans 24/7. News. Socials, etc.”
This isn’t anecdotal. In our July 2023 post, “The Retirement Propaganda War,” we highlighted after 2010, the media has figured out anger, fear, disgust, and sadness drives more engagement (which leads to more advertising revenue).
How else can you explain today’s levels of the economic uncertainty index exceed that of the Global Financial Crisis?
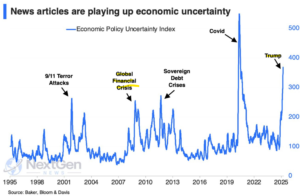
The above chart shows the Economic Policy Uncertainty Index. You would be hard pressed to convince a rational person that today is more uncertain than the Global Financial Crisis. It feels worse today because an investor cannot escape the endless firehose of doom & gloom headlines.
Without a proper information filter, a person is more likely to further entrench in their viewpoints and enter endless doom loops. Men seem to be most at risk of seeking doom & gloom news…
From Michael Finke, professor at the American College…
“There seems to be an epidemic of men watching hate news all day in retirement according to social media groups of retirees. Men seem to be at risk of addictive antisocial behaviors, making everyone (including themselves) miserable.”
U.S. Investors are Spoiled
One of my favorite bloggers, Ben Carlson, brought out an obvious, but overlooked observation…
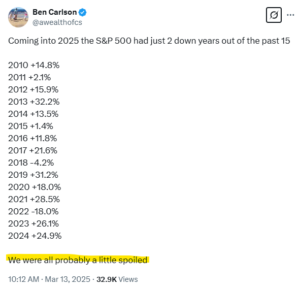
Source: Ben Carlson, Wealth of Common Sense
The above tweet shows the exceptional run of the S&P 500 over the past 15 years. Negative outcomes are part of equity investing and market volatility is normal. Ben is probably right; U.S. investors are a bit spoiled.
Stock market corrections like the one we’re experiencing today are normal and the cost of admission for long-term investors. Investors are rewarded with higher returns in exchange for accepting the volatility that comes with being an owner.
No fear, uncertainty, pain, and volatility = no outperformance. Investors that embrace the uncertain journey have historically been rewarded.
To learn more about how Pure Portfolios manages risk and drawdown for retirees, click here or email us at insight@pureportfolios.com.